
Writing Homework Help
Writing Homework Help. please read the requirement box
In this exercise, you will learn how to create a current state value stream map for CK&N, Inc., a peanut butter and jelly sandwich factory. Based on the Lean Enterprise Institutes philosophy, “Whenever there is a product for a customer, there is a value stream. The challenge lies in seeing it,” CK&N wanted to map their current value stream so that they could make improvements to it as necessary in the future. You and your team are tasked with following the steps below to create the CK&N peanut butter sandwhich process.
Step 1: Calculate takt time in seconds. Don’t proceed until this step is done. Use the following formula to calculate Takt time for your process:
(Available Minutes for Production – Minutes for breaks, meetings, etc./ Required Units of Production)*60 = Takt Time
In our example, we have a daily demand of 700 pieces with the following arrangement.
- Hours per shift: 8
- Break minutes per shift: 30
- Shifts per day: 1
- Days per week: 5
The takt time will tell you how many seconds it will take to produce a completed PB&J sandwhich. Takt Time = _________s.
Step 2: Have a big piece of paper, pencils and erasers ready. You can use software to draw your VSM, however, it is recommended that you always draw the map on paper first. An 11”x17” paper will work best for this exercise.
Step 3: Walk the process front to back. Quickly walk the process with your team in order to understand the general flow. It’s important to also define the start and stop point of the process. Don’t attempt to take on too much. Remember, we eat an elephant one bite at a time.
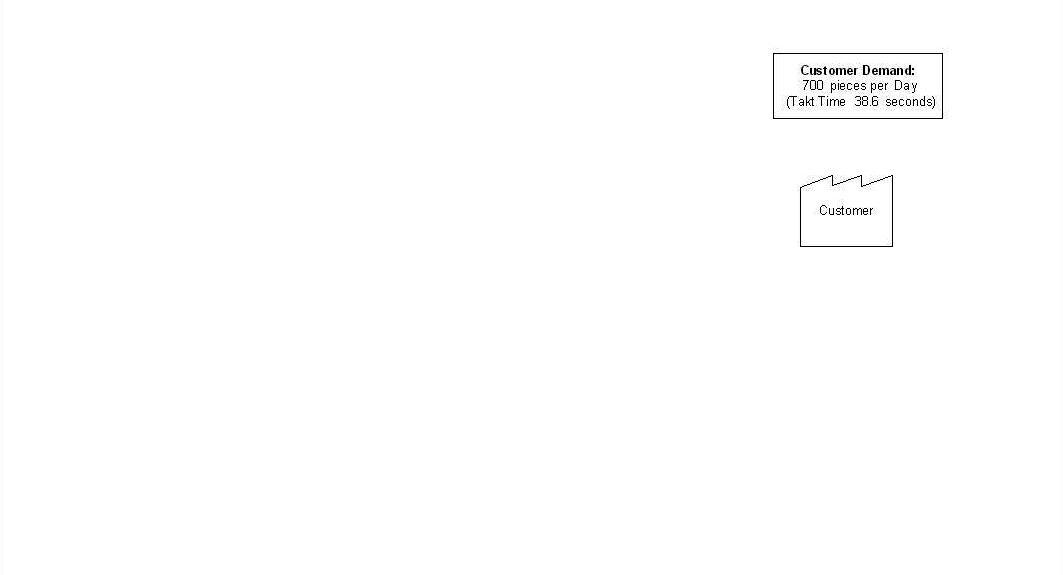
Step 4: Draw in the customer box / details. In the top right hand side of the paper we draw the little saw topped box representing our customer.
We also note their monthly and/or daily demand along with the takt time as calculated in step 1. Click here to see what this looks like.
Step 5: Go to the end! Next, we start at the END of the process and begin drawing the map back to front. And don’t forget about that eraser. You will need it. I recommend you nominate a scribe and have them draw the map for the team.
Another trick is to ask each person on the team to map it out so you can compare and consolidate when you get back to the room. Yet another trick is to have the team divide and conquer as you send some off to map the beginning section, some to the middle, and some to the end.
There are many ways to do this. Experiment and do what works best for your situation.
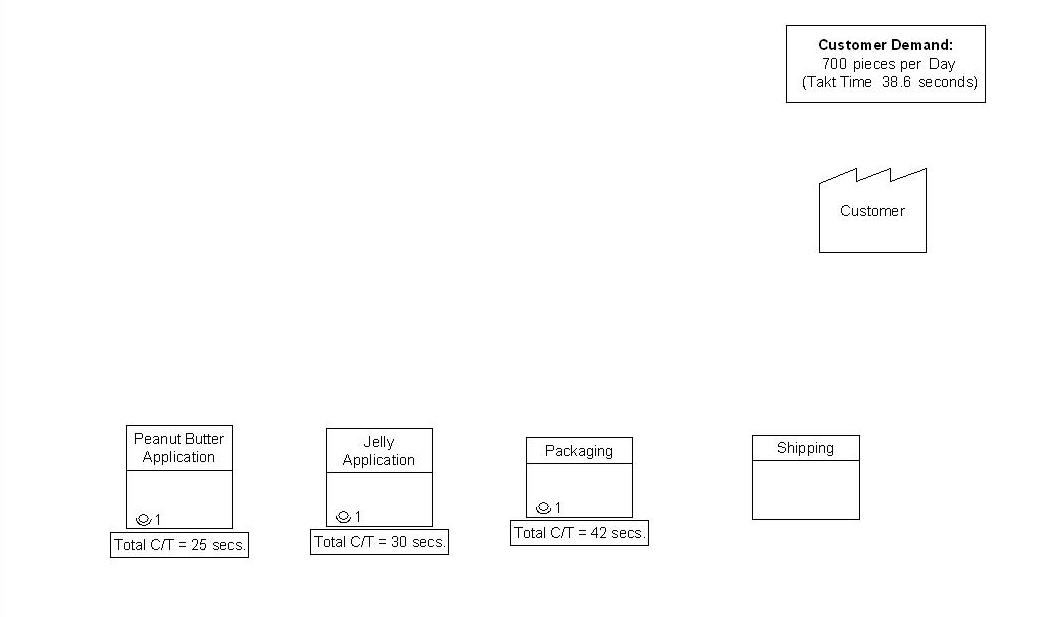
Step 6: Focus on the material flow first. Focus on the material flow side of things first (bottom portion of the map). This includes the process boxes and data boxes.
After studying the KB&R manufacturing process for an afternoon we learned that each process step is staffed with 1 operator. We also collected cycle time information at each step.
Process Steps
Peanut Butter Application: 1 operator : Cycle Time (C/T) = 25 secs.
Jelly Application: 1 operator: C/T = 30 secs.
Packaging: 1 operator: C/T = 42 secs.
Shipping
Click here to see what this looks like on a VSM.
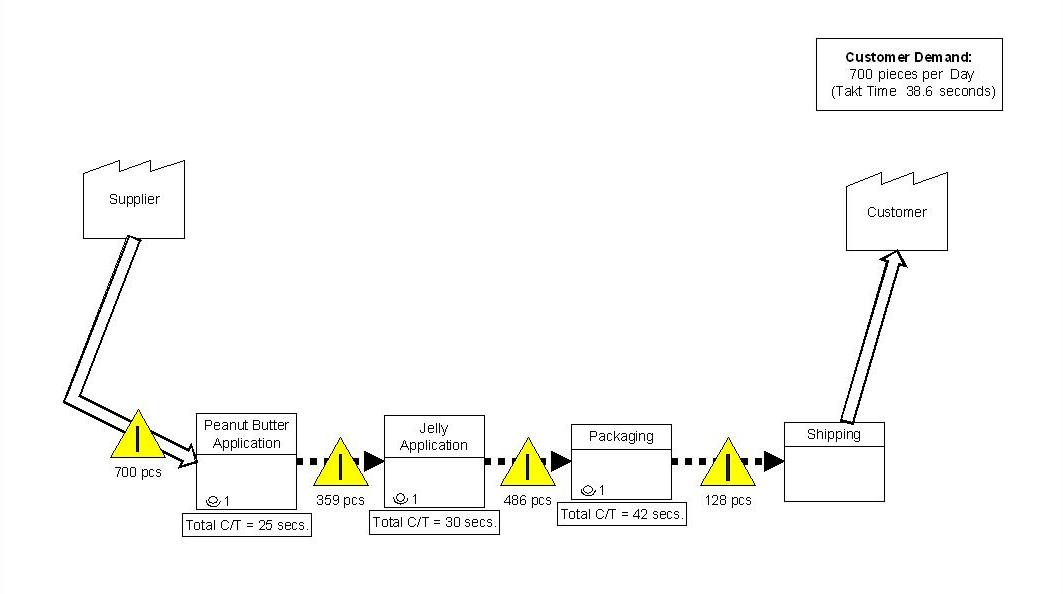
Step 7: Add the Inventory/Wait Times. Once you have all the process and data boxes in, it’s time to add in inventory and/or waiting times. These are represented by little yellow triangles with an “I” in the middle. The “I” stands for inventory.
For inventory, we simply count the number of pieces in between the processes and note them under the triangle.
Inventory at each process step
The supplier sends 700 pieces daily. A Piece = 2 pieces of bread.
359 pieces are needed between the Peanut Butter Application and Jelly Application Stations.
486 pieces are needed between the Jelly Application and Packaging Station.
Click here to see how this looks on a VSM and then read the additional information below.
Additional Info
We also want to convert these pieces into days’ supply. To do this, divide the number of pieces by the average daily demand. The average daily demand is the customer demand, which we already know is 700.
So, if your average daily demand is 700 pieces and you count 359 pieces of inventory in between process step A and process step B you have .5 days’ supply (359/700) in between the two processes. We will note this number on our timeline (to be added in a future step).
NOTE: In a VSM, you don’t have to attempt to map every piece or part number! Choose one or two key components to start with. You can always add more to the map later.
In our example, we chose to simply count two pieces of bread as one subassembly since they move together down the production line.
Also, we are not accounting for the peanut butter and jelly “raw material” at this point since CK&N’s expert supply chain team negotiated a killer consignment stock deal with Sam’s Club so this inventory is quite low on the line.
During the study, we learned that, as one example, there were 486 sub-assemblies (972 pieces of bread) in between the jelly application and packaging stations. This equates to 0.69 days’ supply (486 units / 700 daily demand).
Lastly, during the walk through of the process we noticed that each process step seemed to be working in isolation. In other words, the lady working at the peanut butter application seemed to produce as many units as she could and then pushed them along to the jelly application process.
This “push” process is found in just about every mass production process known to man kind. When we see this pushing action we note it on a VSM with a dashed line through the yellow inventory symbol.
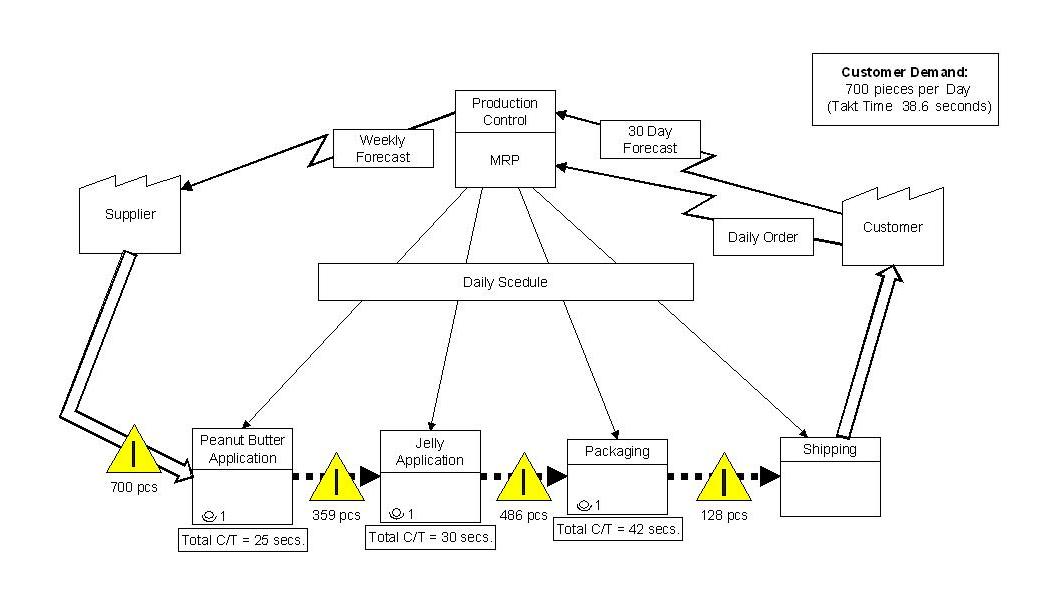
Step 8: Draw in the Production Control box and information flow. In addition to learning about how material flows we also want to understand how information flows.
For example, If information is transmitted between processes electronically, we use a lightning bolt looking arrowed line to represent that information flow. If information is communicated manually between process steps, we use a straight arrowed line.
During this step we first draw in our production control box. Production control is responsible for setting the schedules for each process. In our example, we learned that Production Control schedules each process step in isolation. In other words, each work station gets its unique production schedule. We draw this using straight “manual” information lines to represent that the schedule information is manually given to each process step. The Production Control box I usually represented as a box with the letters “MRP” in it. In most mass production systems, we typically see several manual information (straight) lines coming out of the MRP box aimed straight at each process step box.
We also add in the information flow from our customers as well as to our suppliers. In our example, we learned that PB&J’s customer sends 30 days electronic forecasts as well as electronic daily orders. Conversely, PB&J sends its bread supplier an electronic weekly forecast. Click here to see examples of the Production Control box and the information flow between the process steps, the supplier and the customer.
Step 10: Add in the timeline. We can now add the timeline to the bottom of the value stream map. This saw tooth looking line helps us separate the value added cycle time (taken from data boxes) from the non value added time (days’ or hours’ supply info).
The last step in the process is to sum up all the “value-add” cycle times and note them at the end of the timeline. Likewise, we also sum up the “inventory” times, See information in the Added Info section above, and note that on the timeline.
In our example, the total value add cycle time sums to ___ seconds and the total non value add “inventory” time sums to _____ days. We call the total inventory time the production lead time (PLT).
To calculate the process cycle efficiency (PCE) we divide the value-add time (Total C/T) by the PLT (converted to seconds). What is the PCE? ____%.

Note : I have attached the rubric which will guide about the grading process for this assignment.
"Our Prices Start at $11.99. As Our First Client, Use Coupon Code GET15 to claim 15% Discount This Month!!"

